
This figure looks like a copy of Fig. S1 (a) in the "supplementary information".
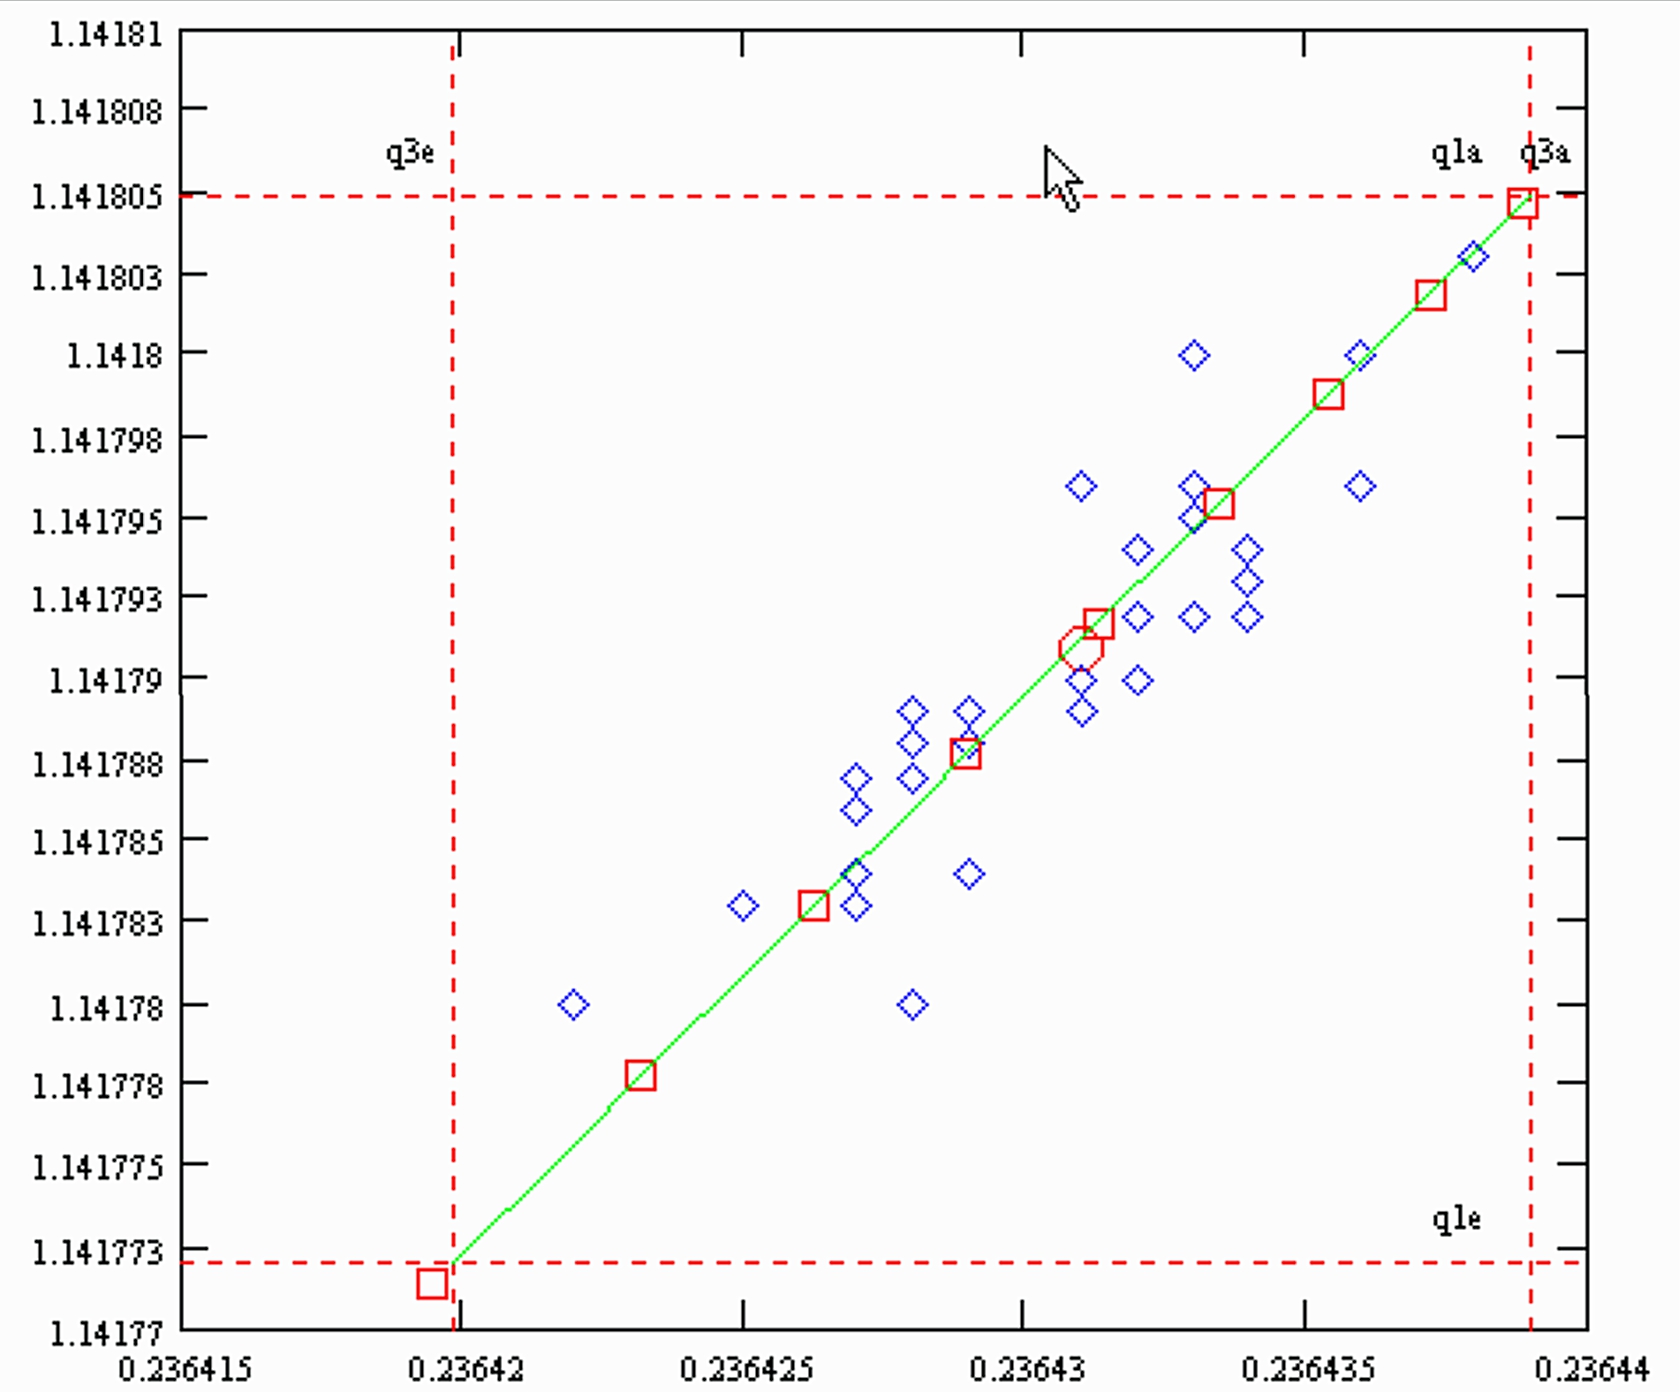
The slope of the simulated "residual correlations", is 1.72 , the same as the slope of the actually measured data, as shown in Fig. S1(a).
However: The green line is the result of a simulation, whereas the (blue) diamonds represent real measurements. The (red) circle marks the (measured) overall mean of all 32 sample runs (from Table S1). Hence, our statement:
The samples of the Caro et al. paper evaporated according to the Rayleigh law, and hence, the advice:
If they would be fractionation corrected with the Rayleigh formulae, no empiric second order correction would be necessary.
The red squares on the simulated green line mark the sample consumption in steps of 10%. Hence, for the "heaviest" sample (Nr. K6) less than 10% of the loaded sample were used up, and the run with the "lightest" sample (A13) consumpted almost 70%.
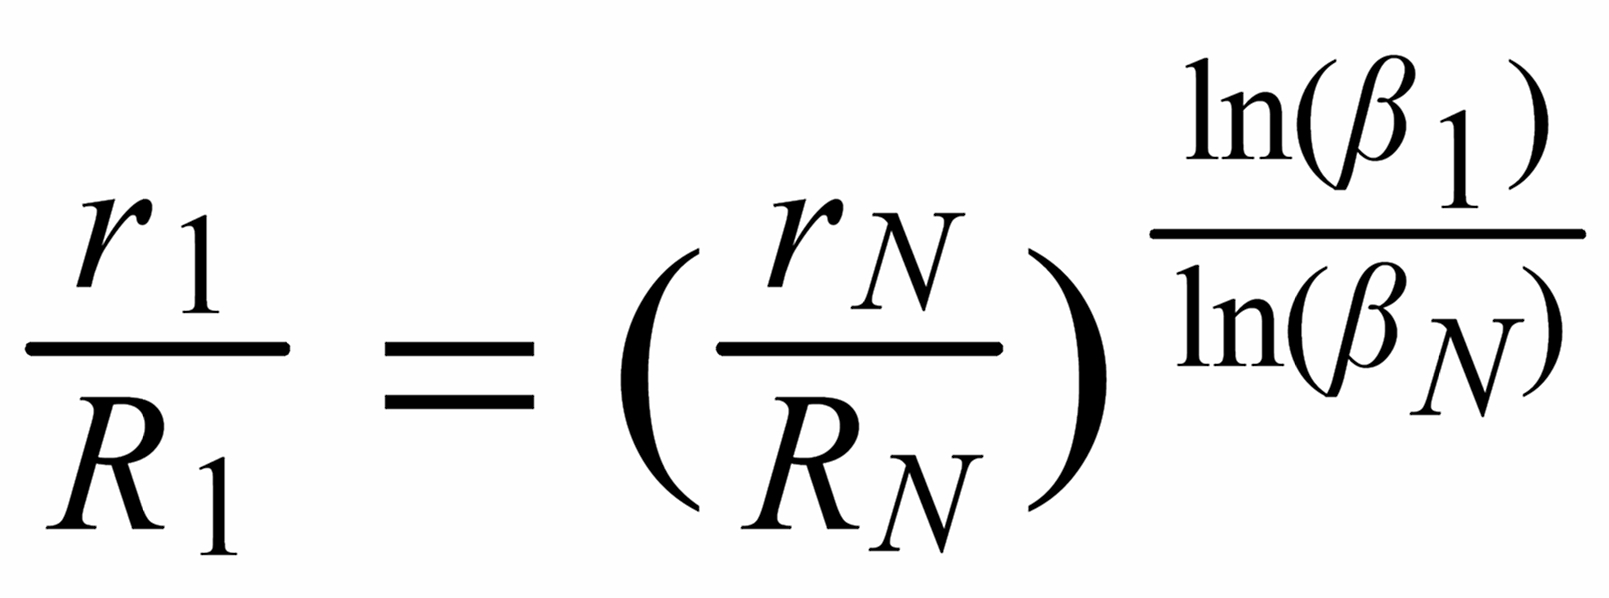
If one combines equ. (8) and equ. (10) by eliminating q, one obtains:
The slope of the simulated "residual correlations", is 1.72 , the same as the slope of the actually measured data, as shown in Fig. S1(a).
However: The green line is the result of a simulation, whereas the (blue) diamonds represent real measurements. The (red) circle marks the (measured) overall mean of all 32 sample runs (from Table S1). Hence, our statement:
The samples of the Caro et al. paper evaporated according to the Rayleigh law, and hence, the advice:
If they would be fractionation corrected with the Rayleigh formulae, no empiric second order correction would be necessary.
The red squares on the simulated green line mark the sample consumption in steps of 10%. Hence, for the "heaviest" sample (Nr. K6) less than 10% of the loaded sample were used up, and the run with the "lightest" sample (A13) consumpted almost 70%.
If one combines equ. (8) and equ. (10) by eliminating q, one obtains:
(i.e. r > R for a light to heavy ratio).
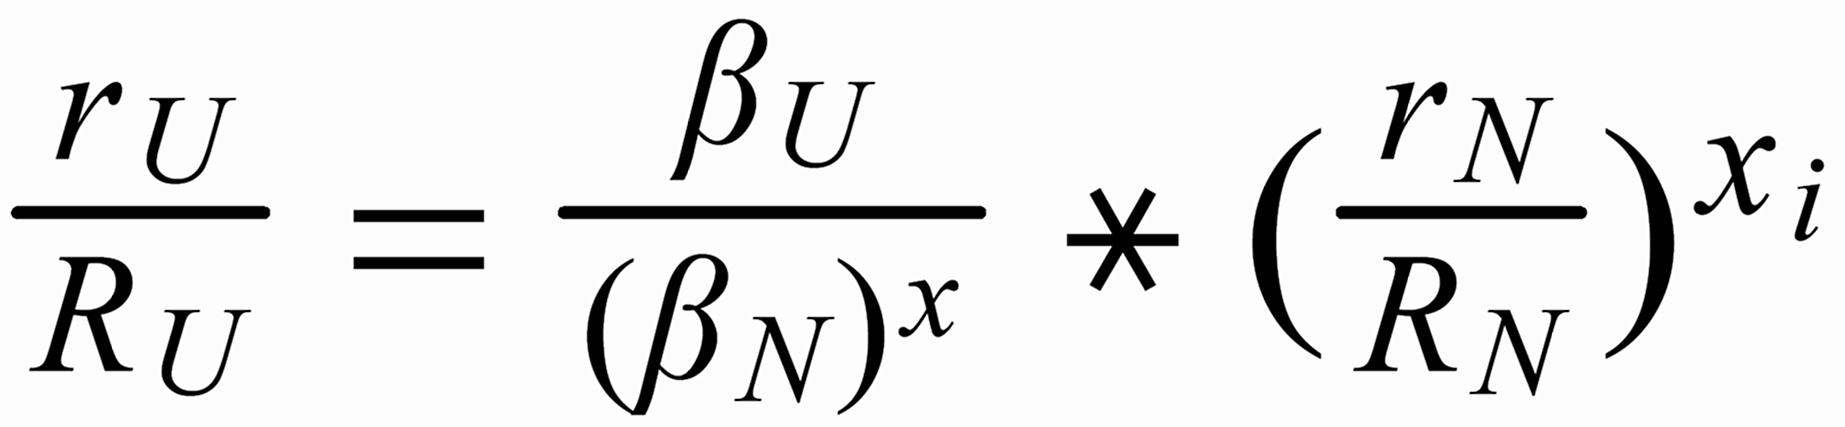
For (internal) fractionation correction of a given isotope ratio rU (true ratio RU ), we need a second isotope ratio (rN) in the same isotopic system, whose true ratio (RN) is known.
Equ. 1 is valid for both ratios, and we can combine them by eliminating q.
Thus, we obtain the "Rayleigh fractionation correction formula" :
and if

Diese Seite steht auch als PDF-Datei zum Download bereit - bitte klicken Sie auf das PDF-Logo.
Remark: All simulations have been performed using MATCAT (Version 7). Additional information may be downloaded:
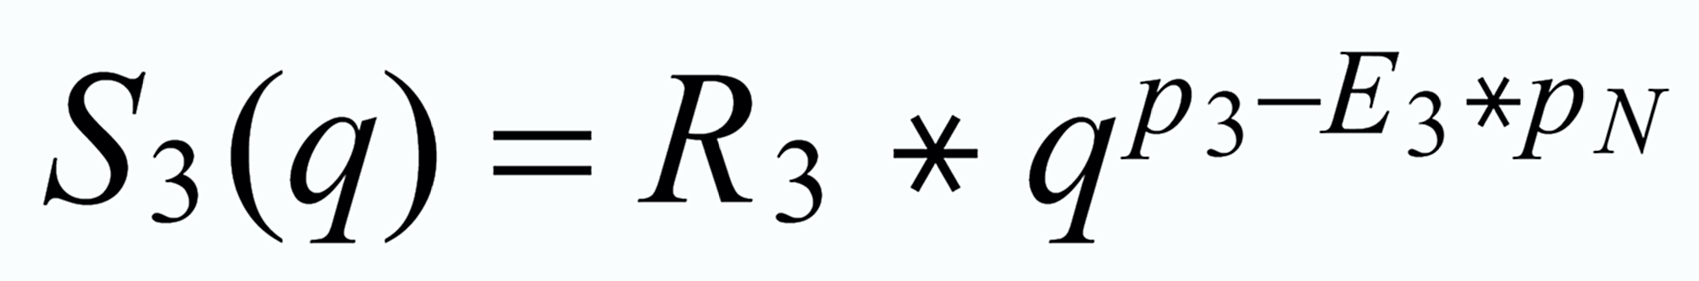
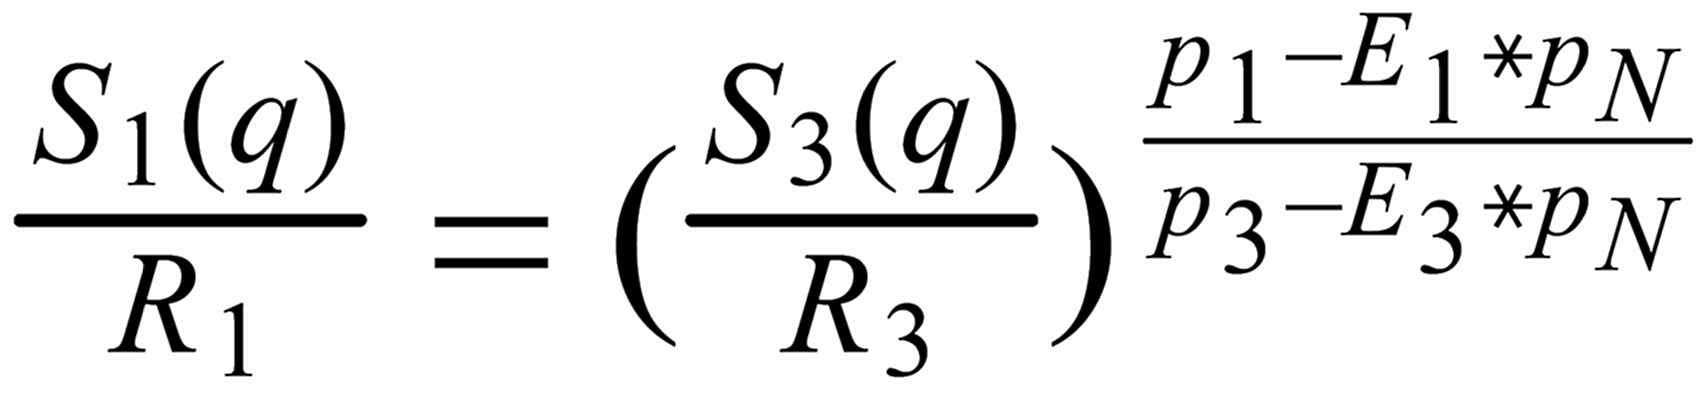
This simulates equation (4) on page 431 of the Caro paper.
Its exponent has a value of -0.355. But there seems to be a conflict between the simulation and the exponent of the "empiric second order correction" formula.
It can be solved quite easily: In the Caro paper, R3 is defined as a heavy/light ratio,hence, the sign of the exponent changes from negative to positive.
Discussion
Experimental details for the individual runs are not given in the Paris paper, but some conclusions can, nevertheless, be drawn.
If the same amount of sample would have been loaded in each run, and if the ion-current-time-profile would have been the same for all sample runs, then the longest run would have been ~7 times longer than the shortest one in the series of 32 runs, because sample consumption differs by a factor of approx. 7 (between K6 and A13).
This is very unlikely. Hence,
a) We speculate: The loaded amount of sample and, probably, the ion-current-time profile were different for each run, whereas the length of the runs might have been more or less comparable.
b) In any case, and this is no speculation, the published data proof that the Paris group has mastered the (black?) art of keeping sample evaporation from a filament reproducible from run to run in an extraordinary way, albeit the use of remarkably different sample loadings.
If a) and b) would not be the case, we would not have any chance to detect the differences between the Exponential and the Rayleigh law fractionation.
To draw a reliable regression line through data over a data range of approx. 30 ppm only, requires an external precision of better than 5 ppm (std dev). This is out of the range of most, if not all data which I have seen up to now.
Just for completeness:
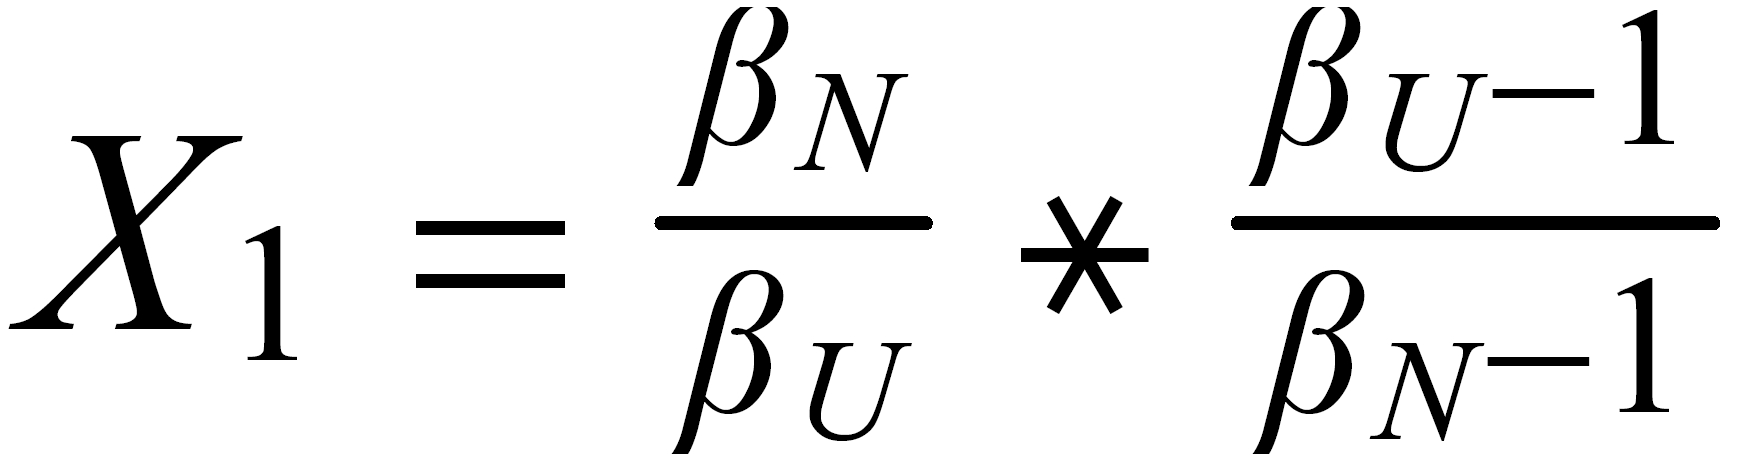
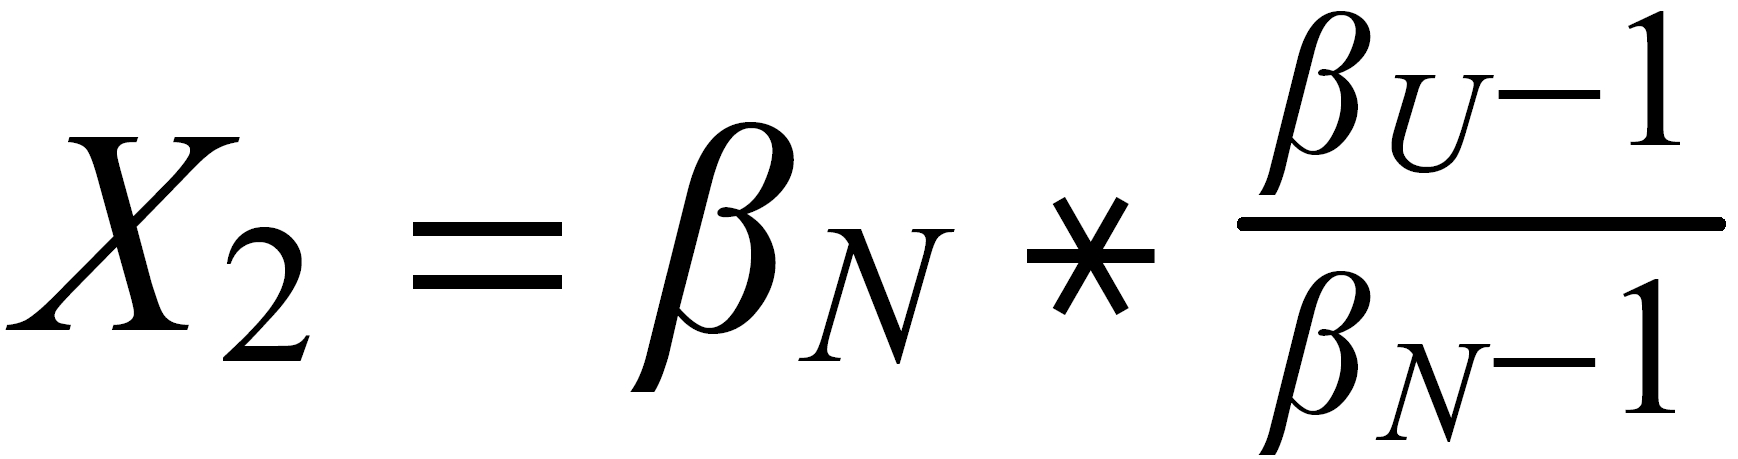
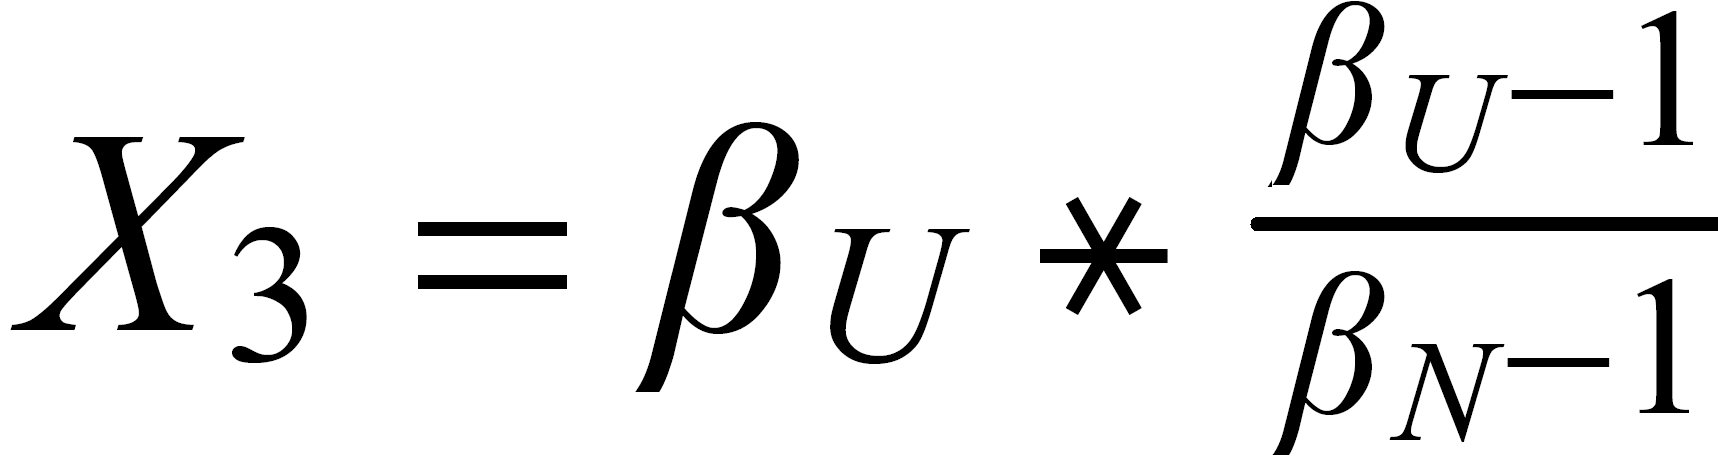
For performing the Rayleigh correction, one would use equ (2), with the following exponents:
X2 for 142Nd/144N and X1 for 150Nd/144Nd.
Warning: If fractionation correction is performed, using the so called linearised Rayleigh law (which I have described earlier (1984)), the results are comparable to the Exponential law results. The simulated "residual correlations" fall on a curved line, which has an average slope of 1.0, as shown in the last graph:
Its exponent has a value of -0.355. But there seems to be a conflict between the simulation and the exponent of the "empiric second order correction" formula.
It can be solved quite easily: In the Caro paper, R3 is defined as a heavy/light ratio,hence, the sign of the exponent changes from negative to positive.
Discussion
Experimental details for the individual runs are not given in the Paris paper, but some conclusions can, nevertheless, be drawn.
If the same amount of sample would have been loaded in each run, and if the ion-current-time-profile would have been the same for all sample runs, then the longest run would have been ~7 times longer than the shortest one in the series of 32 runs, because sample consumption differs by a factor of approx. 7 (between K6 and A13).
This is very unlikely. Hence,
a) We speculate: The loaded amount of sample and, probably, the ion-current-time profile were different for each run, whereas the length of the runs might have been more or less comparable.
b) In any case, and this is no speculation, the published data proof that the Paris group has mastered the (black?) art of keeping sample evaporation from a filament reproducible from run to run in an extraordinary way, albeit the use of remarkably different sample loadings.
If a) and b) would not be the case, we would not have any chance to detect the differences between the Exponential and the Rayleigh law fractionation.
To draw a reliable regression line through data over a data range of approx. 30 ppm only, requires an external precision of better than 5 ppm (std dev). This is out of the range of most, if not all data which I have seen up to now.
Just for completeness:
For performing the Rayleigh correction, one would use equ (2), with the following exponents:
X2 for 142Nd/144N and X1 for 150Nd/144Nd.
Warning: If fractionation correction is performed, using the so called linearised Rayleigh law (which I have described earlier (1984)), the results are comparable to the Exponential law results. The simulated "residual correlations" fall on a curved line, which has an average slope of 1.0, as shown in the last graph:
by Dr. Karleugen Habfast, July 2003, Bremen
Abstract
Recently, Caro et al. have published (Nature 423, p.428) highly precise Nd data from Archean rocks (Ishua/Greenland), using the new TRITON mass spectrometer.
These data are so precise that they, for the first time, allow to safely assess the true nature of the evaporation process of a sample, loaded on the evaporation filament of a thermal ionisation ion source. As a matter of fact, evaporation follows the Rayleigh distillation law.
As a consequence, for such data it will be no more necessary to use empiric laws (like the "Exponential Law" nor any "second order" versions of it) to accurately correct for fractionation.
Introduction
Caro et al. have used the "Exponential law" for fractionation correction of their data, and they write that "the exponential law is obviously the most appropriate to correct for Nd mass fractionation". Nevertheless, after the correction, they observe a small "residual correlation" between two fractionation corrected isotope ratios, if they plot 142/144Nd vs. 150/144Nd. They, therefore, apply ( "in agrrement with Vance and Thirlwall" ) a "second order" correction formula to remove these residual correlations. This "empiric" second order procedure substantially improves the external precision of the data, without changing the average fractionation corrected ratio. However, they don’t explain, how their simple correction formula is (empirically?) derived.
In this short note we simulate the evaporation of a sample by assuming that it follows the Rayleigh distillation law during evaporation. We then apply, for the aim of fractionation correction, Exponential law correction procedures to these simulated data.
The result is, that we are able to quantitatively predict the residual correlations, observed by Caro et al. Therefore, our conclusion is: The sample has followed Rayleigh's distillation law during evaporation and, consequently, it would be appropriate, to also apply a fractionation correction algorithm which is derived from the Rayleigh fractionation process, as described in K. Habfast, Int. J. Mass Spectr. 176 (1998) 133 - 148.
Due to the extremely high precision of the TRITON mass spectrometer, and the application of extraordinary carefull experimental procedures, it is, in fact, the first time that the real nature of the evaporation process of isotopes in a TIMS ion source can be directly demonstrated, albeit the application of a "tricky" indirect method. In so far, this work of the Paris group is in a direct historic line with the pioneering paper of Russel, Papanastassiou and Tombrello (Geochim. Cosmochim. Acta 42 (1978), 1075) which introduced the "Exponential law" to the geochemistry community.
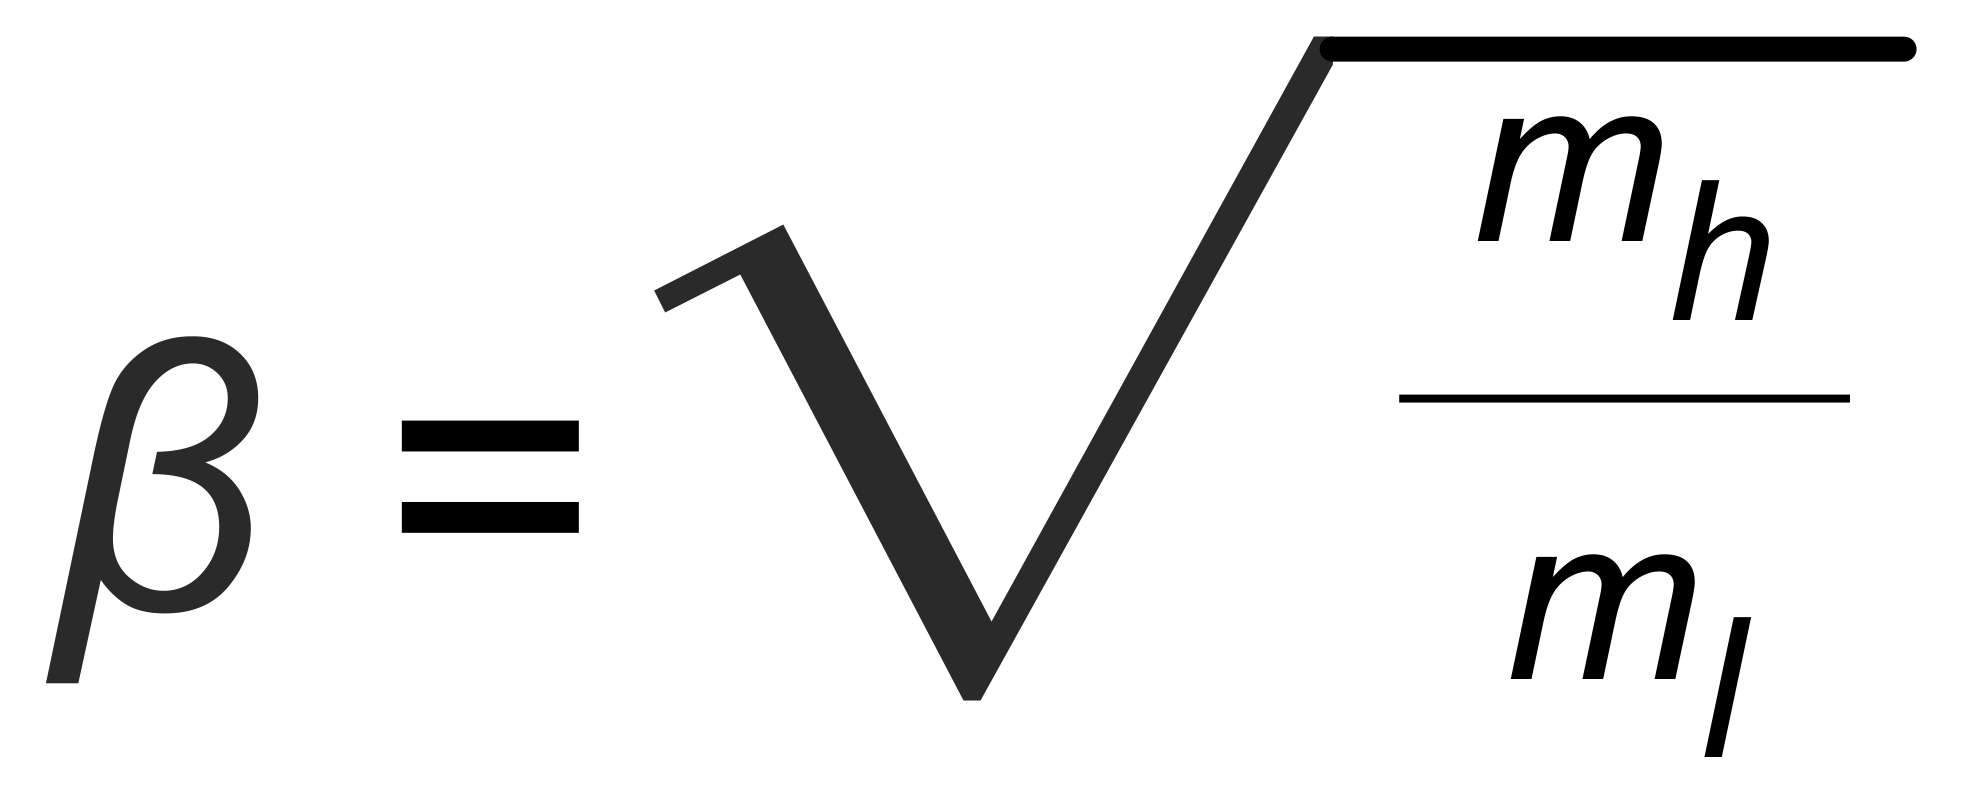
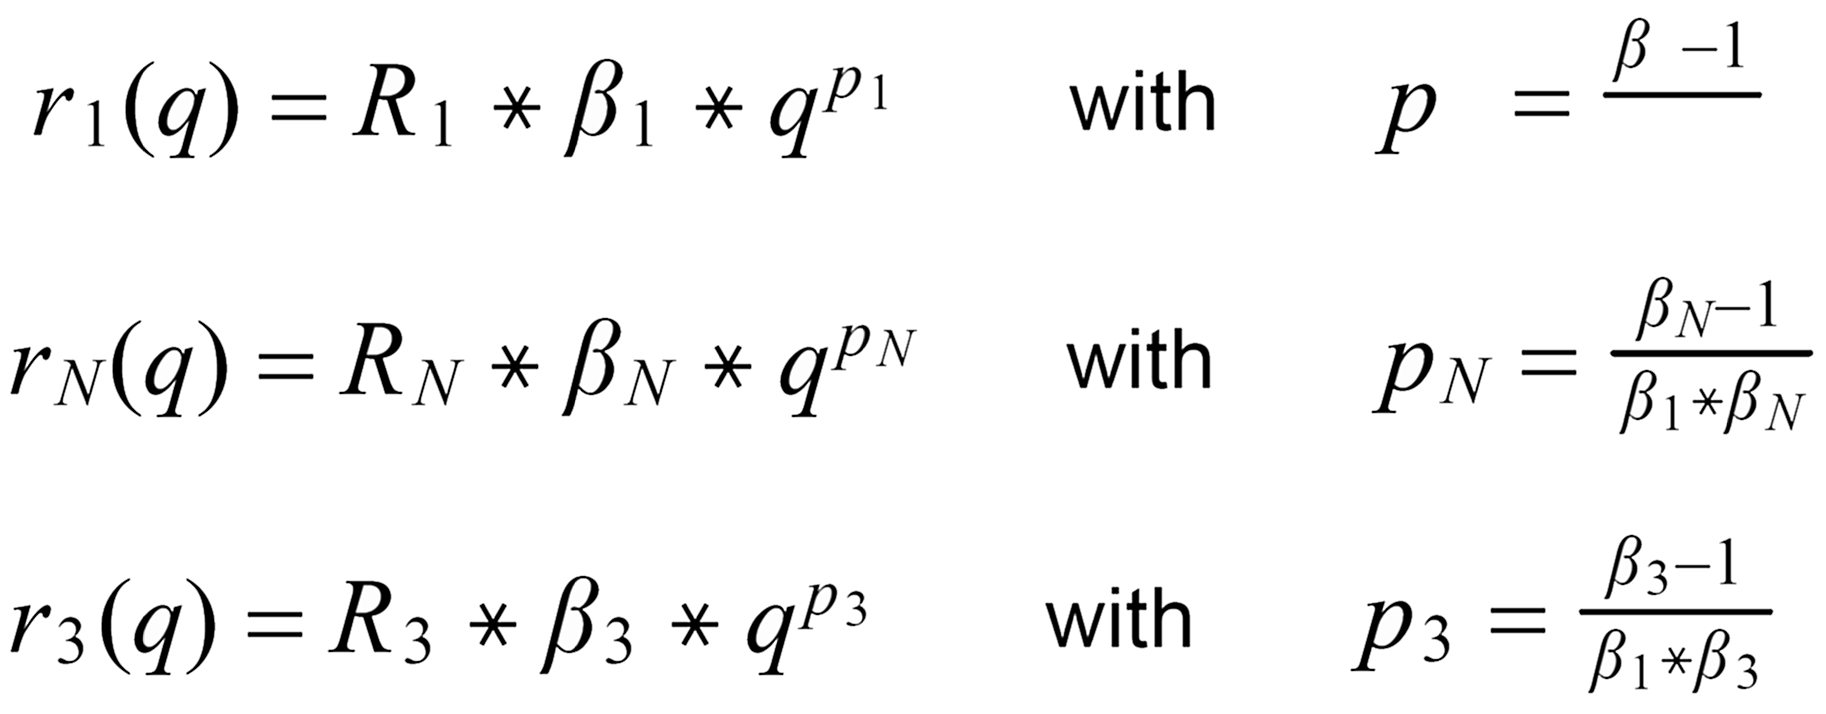
The Rayleigh Distillation Law
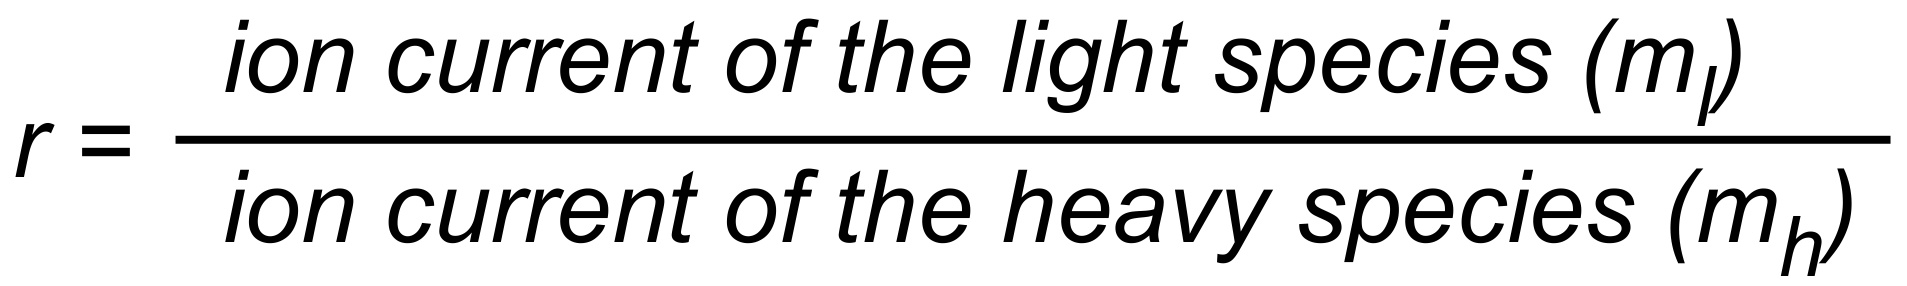
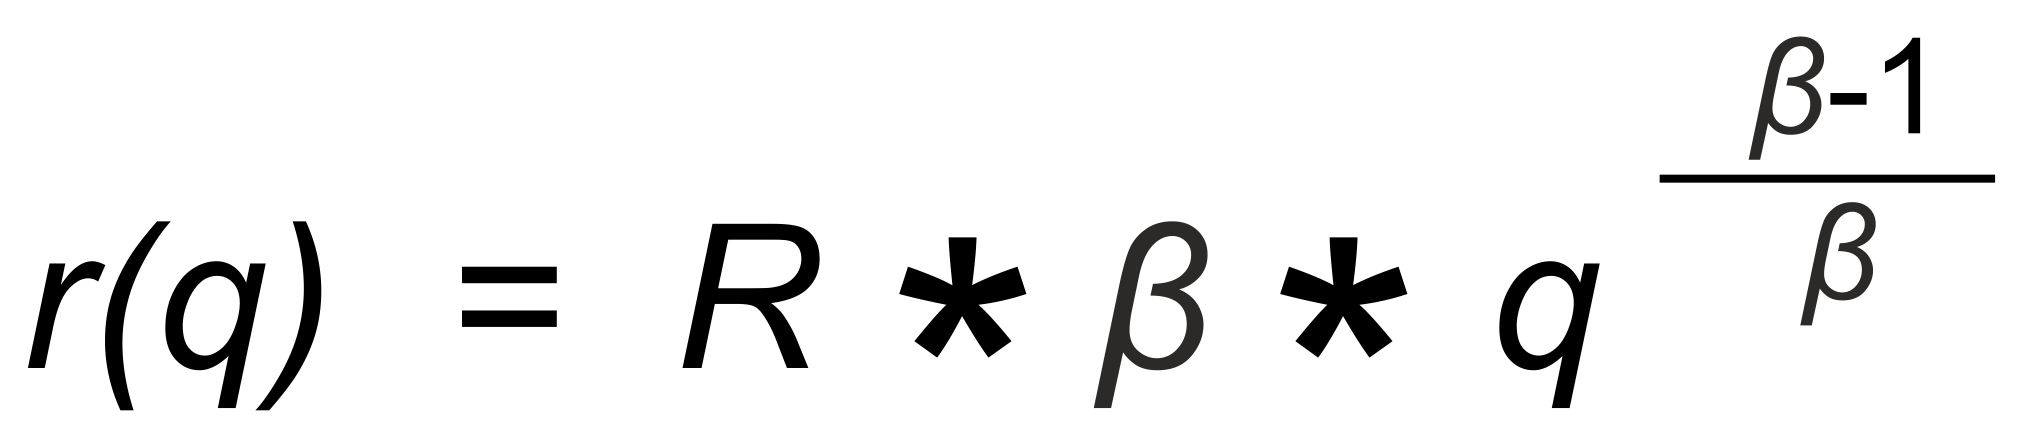
The Rayleigh distillation law (in its explicit form) relates the observed isotope ratior to the mole fraction q of one of its isotopic species. If we define
Abstract
Recently, Caro et al. have published (Nature 423, p.428) highly precise Nd data from Archean rocks (Ishua/Greenland), using the new TRITON mass spectrometer.
These data are so precise that they, for the first time, allow to safely assess the true nature of the evaporation process of a sample, loaded on the evaporation filament of a thermal ionisation ion source. As a matter of fact, evaporation follows the Rayleigh distillation law.
As a consequence, for such data it will be no more necessary to use empiric laws (like the "Exponential Law" nor any "second order" versions of it) to accurately correct for fractionation.
Introduction
Caro et al. have used the "Exponential law" for fractionation correction of their data, and they write that "the exponential law is obviously the most appropriate to correct for Nd mass fractionation". Nevertheless, after the correction, they observe a small "residual correlation" between two fractionation corrected isotope ratios, if they plot 142/144Nd vs. 150/144Nd. They, therefore, apply ( "in agrrement with Vance and Thirlwall" ) a "second order" correction formula to remove these residual correlations. This "empiric" second order procedure substantially improves the external precision of the data, without changing the average fractionation corrected ratio. However, they don’t explain, how their simple correction formula is (empirically?) derived.
In this short note we simulate the evaporation of a sample by assuming that it follows the Rayleigh distillation law during evaporation. We then apply, for the aim of fractionation correction, Exponential law correction procedures to these simulated data.
The result is, that we are able to quantitatively predict the residual correlations, observed by Caro et al. Therefore, our conclusion is: The sample has followed Rayleigh's distillation law during evaporation and, consequently, it would be appropriate, to also apply a fractionation correction algorithm which is derived from the Rayleigh fractionation process, as described in K. Habfast, Int. J. Mass Spectr. 176 (1998) 133 - 148.
Due to the extremely high precision of the TRITON mass spectrometer, and the application of extraordinary carefull experimental procedures, it is, in fact, the first time that the real nature of the evaporation process of isotopes in a TIMS ion source can be directly demonstrated, albeit the application of a "tricky" indirect method. In so far, this work of the Paris group is in a direct historic line with the pioneering paper of Russel, Papanastassiou and Tombrello (Geochim. Cosmochim. Acta 42 (1978), 1075) which introduced the "Exponential law" to the geochemistry community.
The Rayleigh Distillation Law
The Rayleigh distillation law (in its explicit form) relates the observed isotope ratior to the mole fraction q of one of its isotopic species. If we define
we obtain
(1)
R is the "true" isotope ratio of the sample before the start of the evaporation (i.e., if q = 1),
with
, and we thus get
(2)
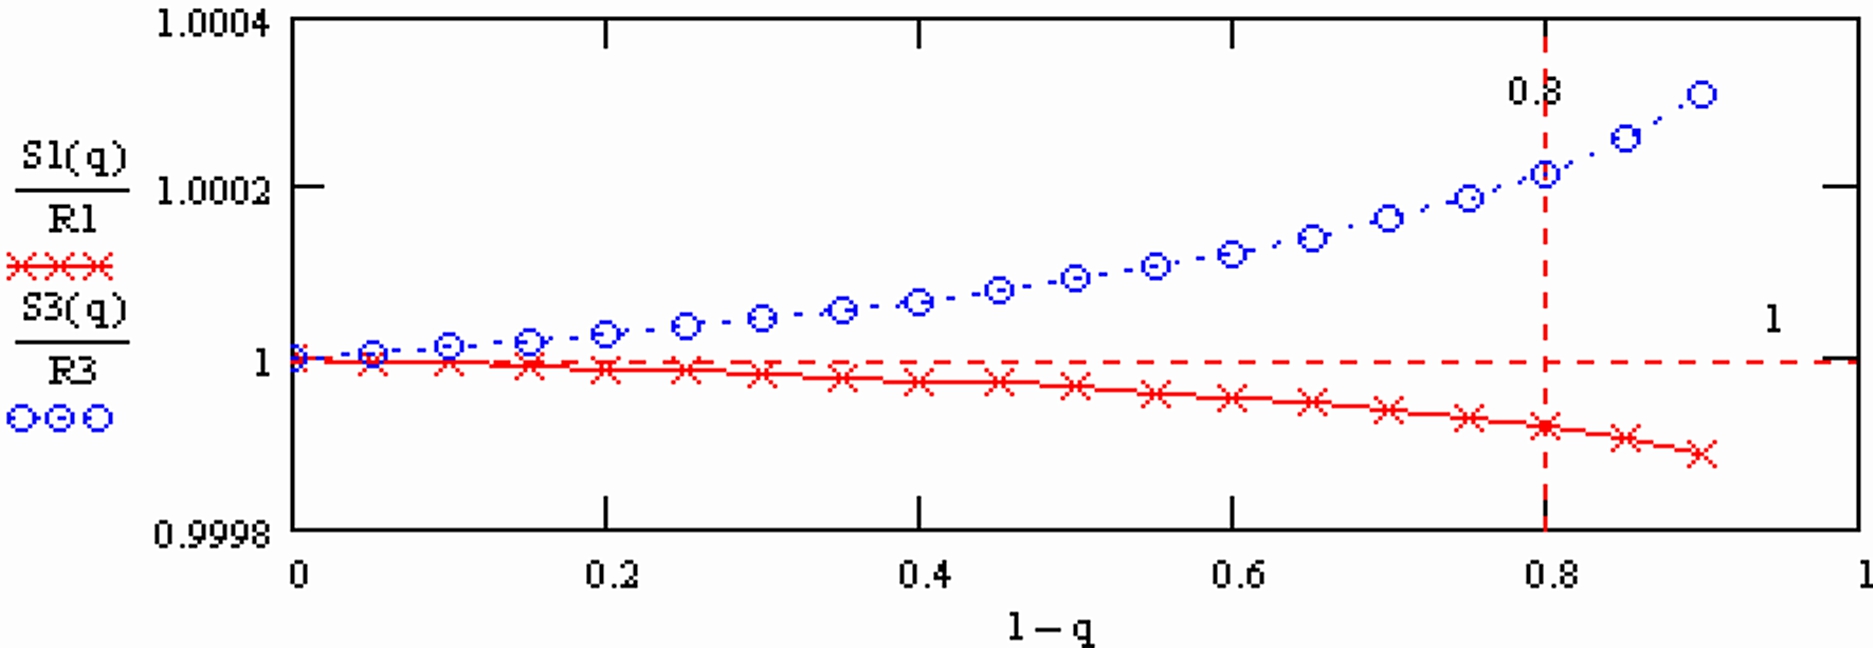
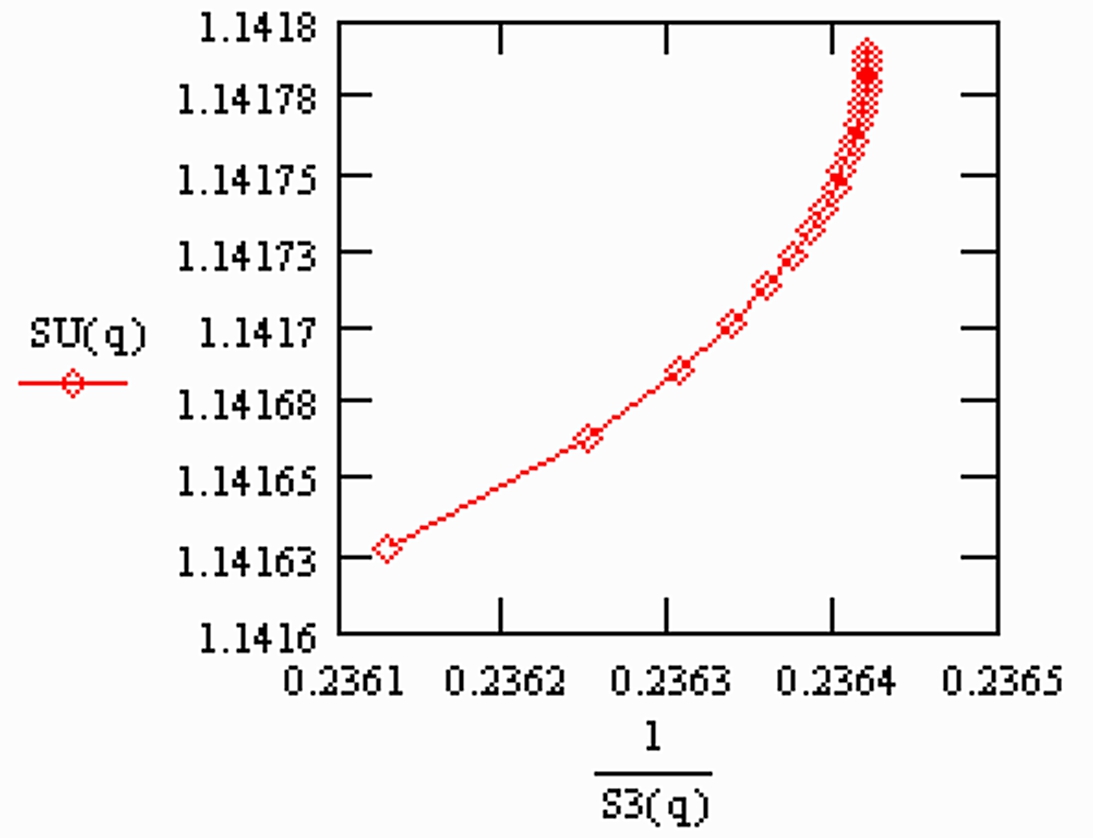
R3 has been inverted in the plot, corresponding to the definition of R3 by the Paris group.
Appearantly, the "normalised ratios" still slightly depend on time (the X-axes is the mole fraction of the sample which is still on the filament at the time of the measurement).
In summary:
S1(q) is "overcompensated" by normalisation, whereas 1/S3(q) is not fully compensated.
Therefore: The run means of each ratio also will depend on time, i.e., on the amount of sample which is left on the filament at the time, at which the run was terminated.
Given the amount qe, at which the run has been stopped, the run means SM1(qe) of S1(q) or SM3(qe) of S3(q), respectively, are as follows (with integration limits from qe ... 1):
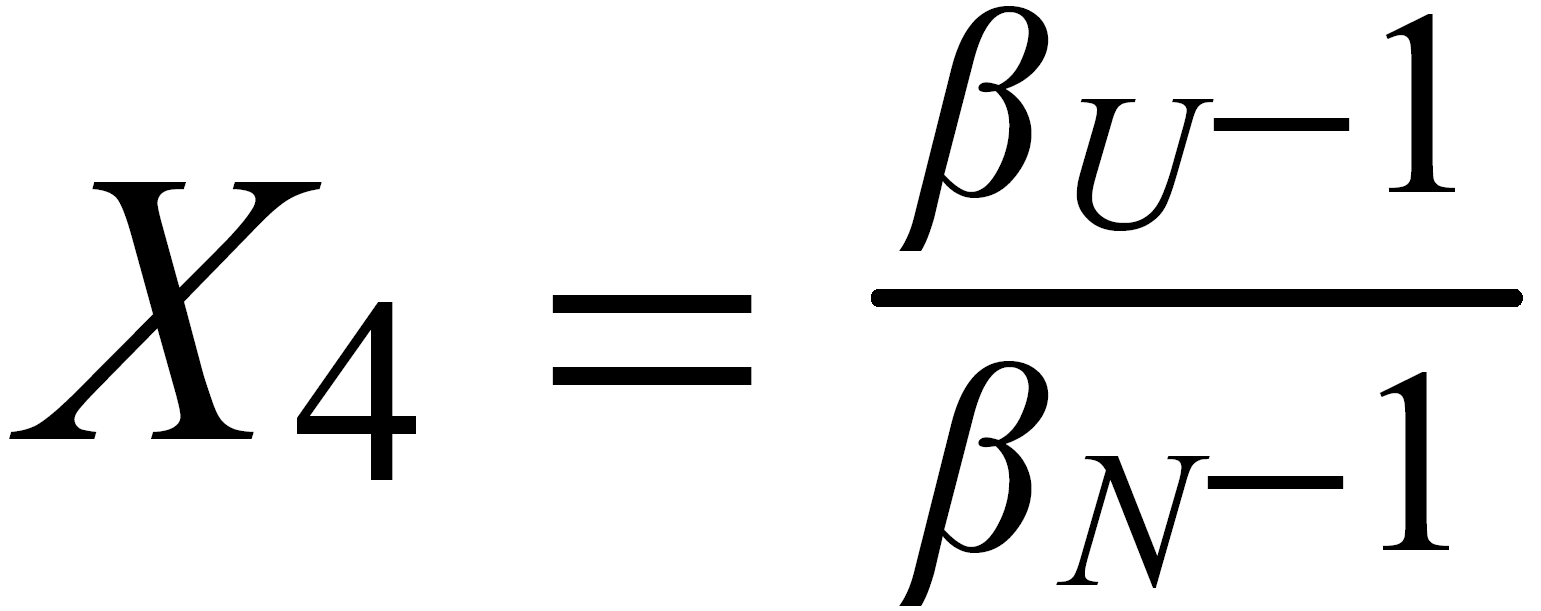
Concerning X i , it is important to follow the rule, to define both ratios in the "same direction" (light/heavy resp. heavy/light ), and to relate both ratios to the same mole fraction of a given isotopic species. This requires that both ratios ( ru and rN ) have one isotopic species in common. As a consequence of this strict requirement, we have to observe 4 different definitions for exponent Xi dependingon the particular definition of the ratios:
The required conditions for the two ratios can, in rare cases, be fullfilled only with the help of an "auxiliary" ratio. This, however, is no limitation.
Remark: The above conditions for the definition of the ratios can be circumvented, if the general Rayleigh equation is choosen, in which the true ratio of the unknown species (RU) is given in an implicit form. This, however, requires the application of an iterative procedure to solve the equation (Karleugen Habfast, Int. J. Mass Spectr. 176 (1997) p 135, equ. (9c) ).
Simulation of Neodymium isotopic evaporation and fractionation.
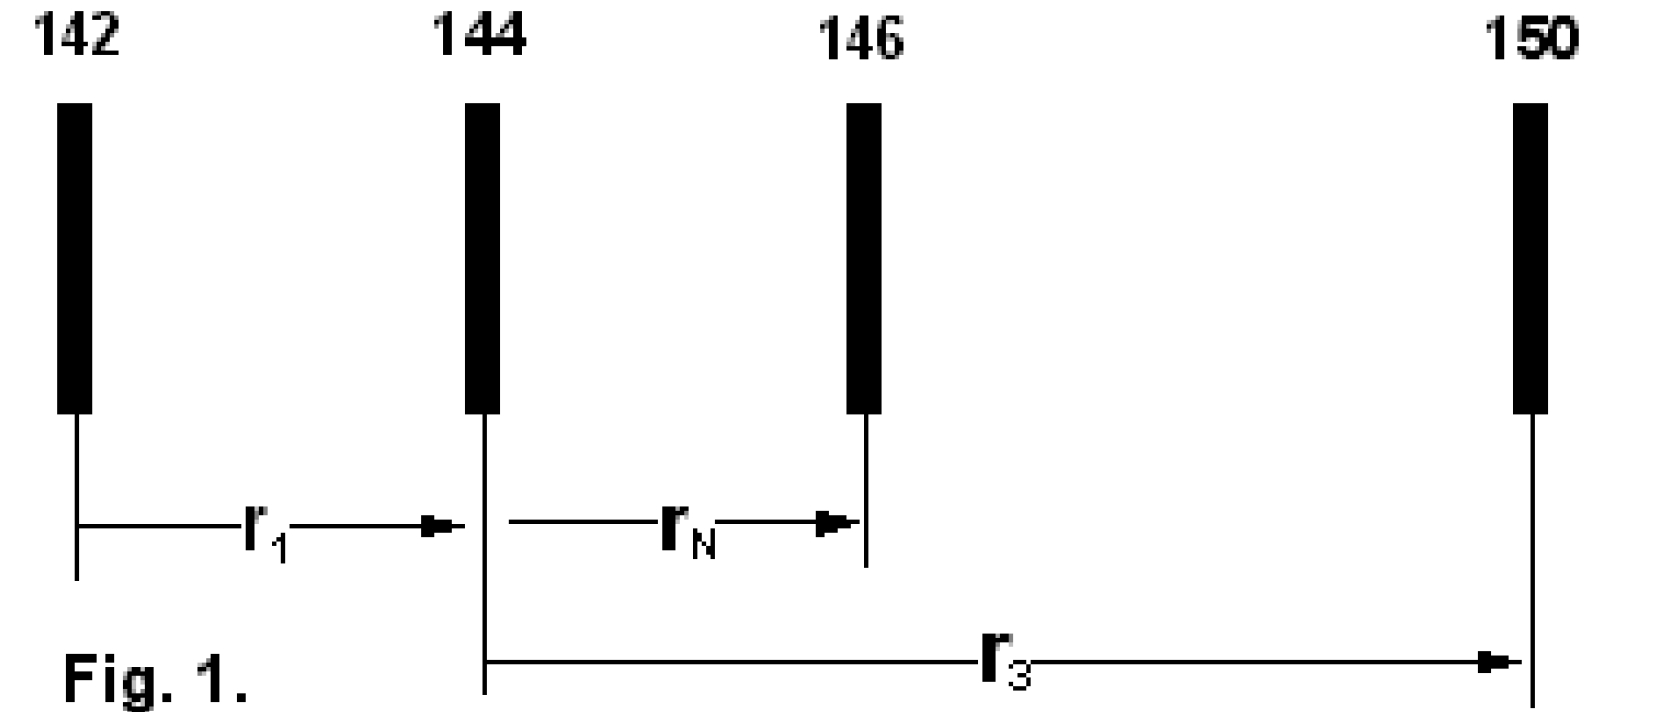
We consider the isotopic system [142...144...146...150]-Nd (see Fig.1) and we define three (light/heavy) - ratios, namely: r1: [142/144] ; rN: [144/146] and r3: [144/150] .
Remark: The above conditions for the definition of the ratios can be circumvented, if the general Rayleigh equation is choosen, in which the true ratio of the unknown species (RU) is given in an implicit form. This, however, requires the application of an iterative procedure to solve the equation (Karleugen Habfast, Int. J. Mass Spectr. 176 (1997) p 135, equ. (9c) ).
Simulation of Neodymium isotopic evaporation and fractionation.
We consider the isotopic system [142...144...146...150]-Nd (see Fig.1) and we define three (light/heavy) - ratios, namely: r1: [142/144] ; rN: [144/146] and r3: [144/150] .
The lowest mass is common to both ratios
The "middle" mass is common to both ratios (rU is the "lower" ratio).
The "middle" mass is common to both ratios (rU is the "upper" ratio).
The highest mass is common to both ratio
rN is the normalising ratio for the other two ratios.
First of all, we need to relate all three ratios to the mole fraction of the same isotope. We arbitrarily, select the lightest species [142] . In order to get this species as a base for the mole fractionsof all ratios, we use two auxiliary ratios, namely
First of all, we need to relate all three ratios to the mole fraction of the same isotope. We arbitrarily, select the lightest species [142] . In order to get this species as a base for the mole fractionsof all ratios, we use two auxiliary ratios, namely
resp.
With proper application of (Equ. 1) we thus get the so called "evaporation profiles" r=f(q), q being the mole fraction of the [142] - species:
By application of the Exponential Law:
(3)
(4)
(5)
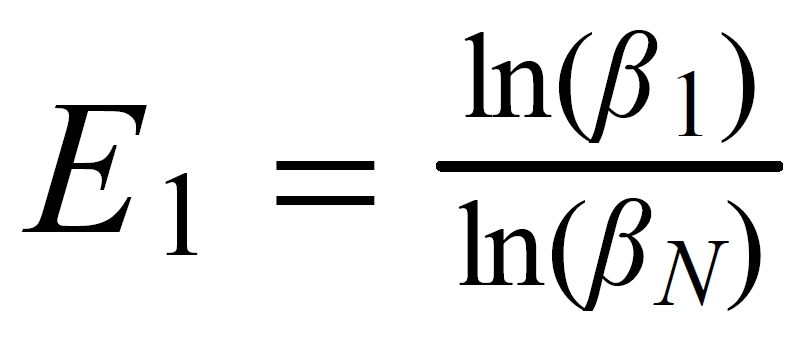
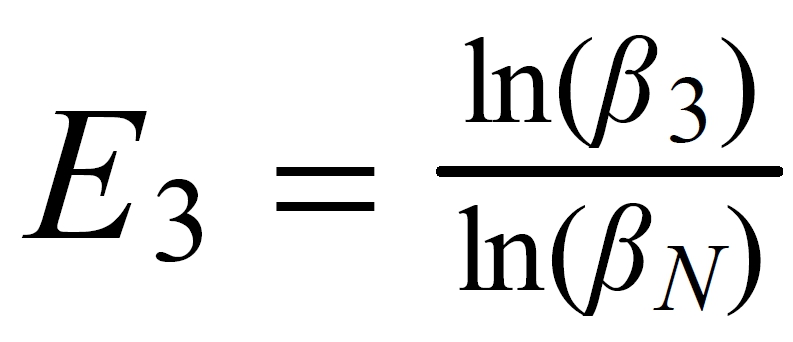
we finally will obtain the fractionation corrected true ratios R 1 resp. R 3.
As all observed isotope ratios are varying with time (i.e. with the evaporated amount of sample), it is expected that fractionation correction fulfills two basic requirements:
a) The corrected ratios must be independent from time, and
b) the corrected ratios must numerically reflect the true ratio of the sample, i.e the
b) isotope ratio of the sample before
b) any evaporation (fractionation) has taken place.
It has been shown by the author that the Exponential law and the Rayleigh law lead to very similar results, but both laws nevertheless show important differences. But these are so small, that highly precise data are required for a differentiation between the two laws.
Indeed, the application of the Exponential Law ( equ (6), equ (7) ) to data which evaporate according to the Rayleigh distillation law (equ(3) .. (5)), leeds to results, in which the "true" values are still slightly time dependent after the correction, and they reflect the true value only, if they are extrapolated to the beginning of the measurement. The explicit equations (for the dependence of the "true" ratio from time) are as follows:
(6) resp.
(7)
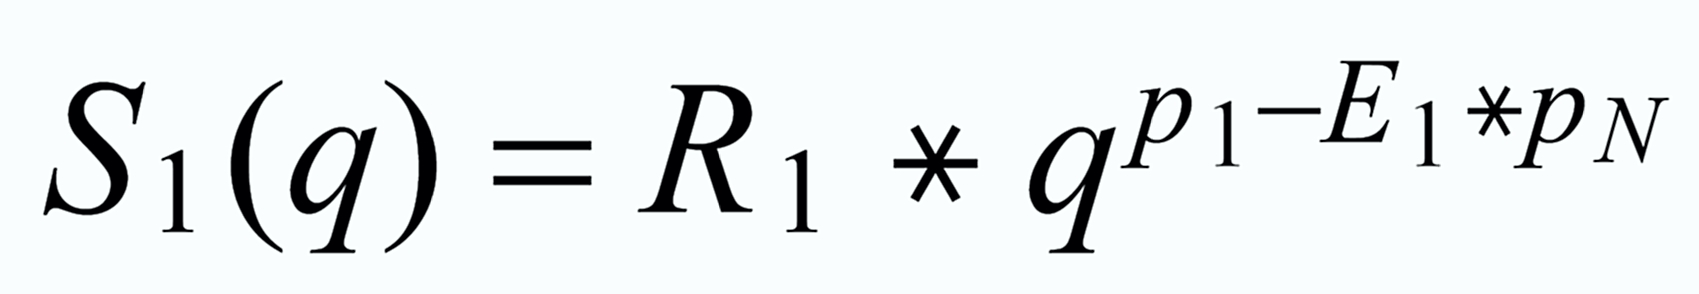
(8)
(10)
(9)
(11)
This dependence is shown in the following graph (Fig. 2), using normalised values
(12)
(13)
In Fig. S1(a) of the "supplementary information" for their paper, Caro et al. have plotted the exponentially fractionation corrected run means of a total of 32 sample runs of an AMES Nd-Standard. These run means are listed in Table S1 of the "supplementary information". The span of the 142Nd/144Nd and 150Nd/144Nd means is ~22ppm or ~66ppm, respectivly.
In the next graph we have plotted the simulated residual correlations of SM1(qe) vs. 1/SM3(qe), together with the measured data of Table S1 of the Caro et al. paper.
In the next graph we have plotted the simulated residual correlations of SM1(qe) vs. 1/SM3(qe), together with the measured data of Table S1 of the Caro et al. paper.
(14)


Dr. Karleugen Habfast: ToFC - Recent News: Note on fractionation correction for Nd isotope ratios


